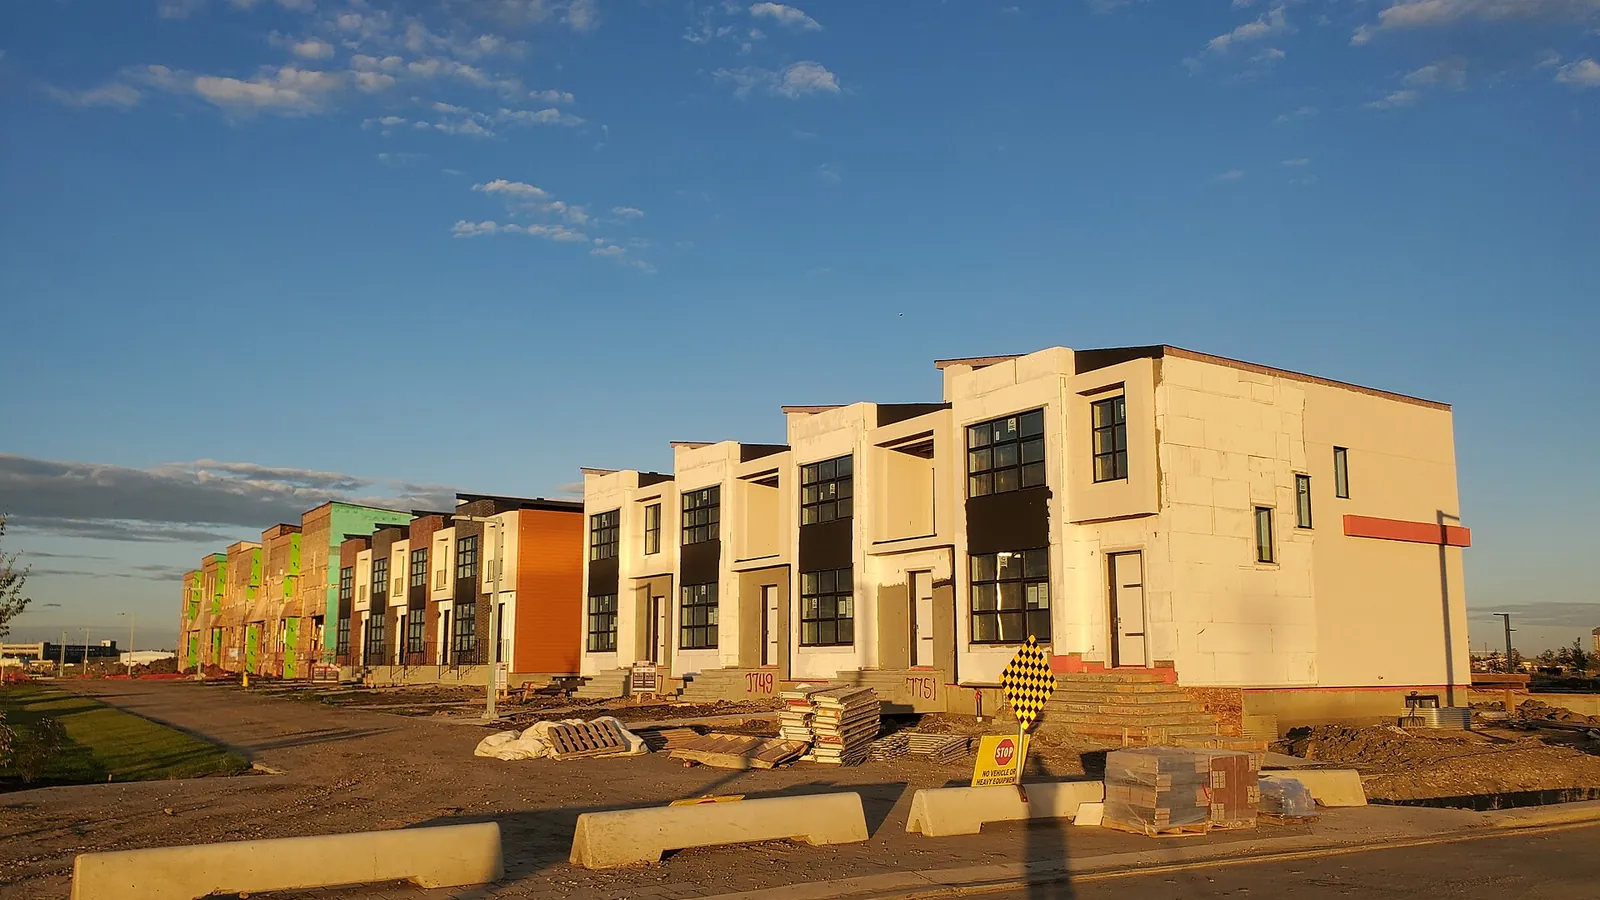
What happened
Canada Mortgage and Housing Corporation (CMHC) released housing starts (the number of new homes on which construction began) for September 2026 on October 16, 2026. These are the figures in the release.
- The three largest cities: Montreal’s trend fell 8% (fewer multi-unit starts), Vancouver’s rose 6% (more multi-unit starts), and Toronto’s was flat because single-detached and multi-unit trends offset each other.
- Next release: October housing starts come out on November 17 at 8:15 a.m. ET.
| Item | September 2026 | Compared with |
|---|---|---|
| Actual starts (centres of 10,000 or more) | 19,984 units | Down 11% from 22,375 in September 2025 |
| Actual starts, January to September | 170,964 units | Down 4% from the same period last year |
| Seasonally adjusted annual rate (SAAR), all areas | 248,896 units | Up 3% from 242,223 in August |
| Six-month trend | 250,411 units | Virtually flat |
| Units under construction (centres of 50,000 or more) | 371,617 units | Flat compared with August |
| Completions | 17,398 units | Down 0.9% from August |
| Permitted but not yet started | 143,929 units | Up 1.1% from August |
In charts: the last three Septembers
Comparing the same month removes the seasonal effect. The left chart shows actual starts, the basis of the "down 11%" headline; the right chart shows the seasonally adjusted annual rate (SAAR).
| Period | Value (units) |
|---|---|
| Sept 2024 | 18,806 |
| Sept 2025 | 22,375 |
| Sept 2026 | 19,984 |
Why these years: The three most recent Septembers, side by side in the same way.
CMHC restates last year’s number in the next year’s release. Sept 2024 is from the September 2025 release and Sept 2025 is from the September 2026 release.
Source: CMHC news release, September 2026 housing starts (checked Nov 2, 2026). Bars start at zero.
| Period | Value (units) |
|---|---|
| Sept 2024 | 223,808 |
| Sept 2025 | 279,234 |
| Sept 2026 | 248,896 |
Why these years: The same three Septembers as the left chart.
First-release figures from each year’s September release (2024, 2025, 2026). The Toronto CMA annual rate is not in the releases, so it is not shown.
Source: CMHC news releases (September 2024, 2025, 2026 starts) (checked Nov 2, 2026). Bars start at zero.
The terms in plain words
- Housing starts: the number of new homes where foundation work began. A home started today is usually ready to move into one to three years later (longer for condos).
- Seasonally adjusted annual rate (SAAR): the month’s pace converted to a full year, with the spring-and-summer construction season smoothed out, so months can be compared.
- Six-month trend: a six-month average of the annual rate. One condo tower can make a single month jump, so CMHC says to read the trend alongside the monthly number.
- Multi-unit: condos, apartments and townhouses, where one building holds many homes. They make up most of Toronto’s starts.
How CMHC explained it
CMHC’s Deputy Chief Economist, Aled ab Iorwerth, said in effect that a key risk for Canada now is not building enough during this period of softer housing markets. Of the four most populous provinces, only Quebec has seen modest gains in starts in 2026, and each of the seven major centres CMHC covers is behind last year’s pace. In his view, the long-term supply gap remains, and unless construction increases, the affordability gains since 2023 will be hard to sustain.
What it means if you are buying, selling or renting in the GTA (explained)
This is not advice. It explains what the statistics mean in plain words.
- Buyers: fewer starts now means fewer new homes to move into two to four years from now. This number affects supply years ahead, not today’s price. Right now there are many listings and prices are below last year (see the TRREB September figures), so it takes time for a supply shortage to show up in prices.
- Pre-construction buyers: fewer starts also means developers do not begin construction until enough units are sold. Before you sign, check whether the project has actually started and how many times the occupancy date has moved. There are 143,929 units with permits that have not started.
- Sellers: less new supply means fewer competing homes for resale homes in the long run. But that plays out over years; the price you get today depends more on current listings and interest rates.
- Renters: if fewer condos and rental buildings are built, the rental market can tighten again in a few years. Today more listings favour tenants, but keep this in mind if you are planning long term.
What to watch next
- October housing starts: CMHC releases them on November 17. Check the CMHC website for the schedule.
- TRREB’s October Market Watch usually comes out in the first week of the following month. Check the release date on trreb.ca.
- The numbers here are from the CMHC release of October 16, 2026; CMHC can revise them in later months.
Sources (open the originals)
- Original: CMHC — checked Nov 1, 2026
- CMHC, Housing Market Information Portal (starts by city) — checked Nov 1, 2026